Monitoring Stack for Startups: Prometheus vs CloudWatch vs Datadog
A practical comparison of monitoring tools helping you choose between Prometheus, CloudWatch, and Datadog based on cost, complexity, and feature tradeoffs.
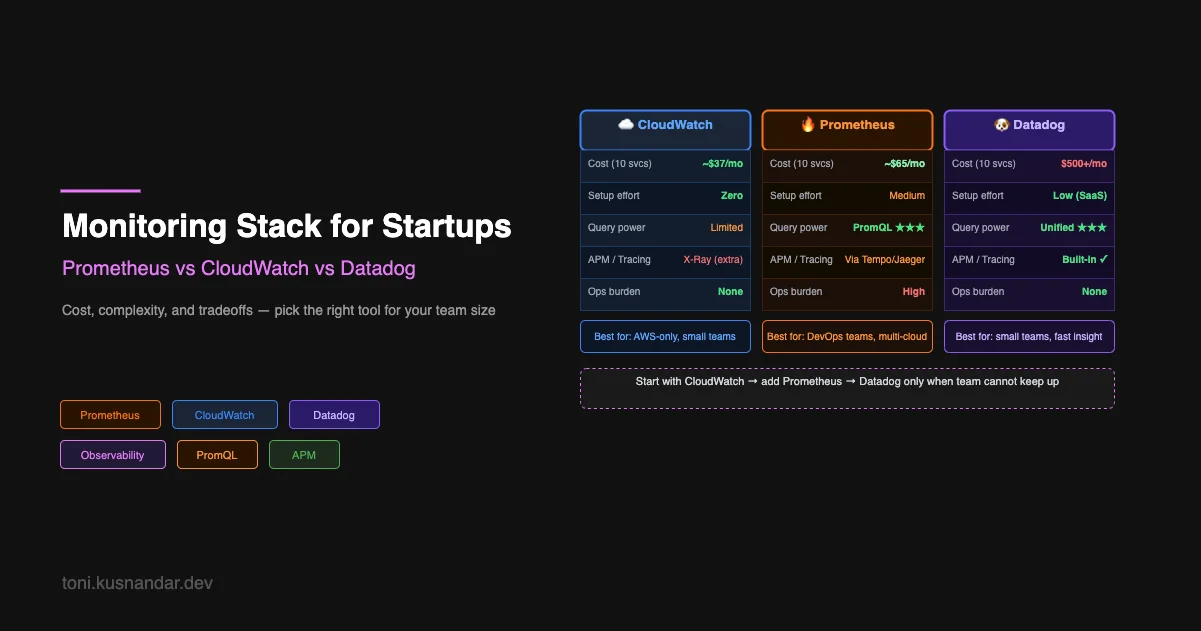
Every production system needs monitoring. The question is not whether you need it, but which tool matches your team size, AWS footprint, and budget. I have set up monitoring for startups with 2 engineers and for teams with dedicated SRE departments. The right choice depends on tradeoffs most articles skip.
This is not a feature comparison. You can find those in vendor documentation. This is a decision guide based on real projects where I had to balance cost, operational complexity, and engineering time. If you are choosing a monitoring stack right now, this will help you avoid expensive mistakes.
This guide assumes you run workloads on AWS. If you are multi-cloud or on-premise, the tradeoffs shift significantly. For context on AWS architecture patterns, see my guide on AWS architecture for small teams.
The Three Options
Here is the high-level positioning:
| Tool | Best For | Cost Model | Operational Burden |
|---|---|---|---|
| CloudWatch | AWS-native workloads, basic monitoring | Pay for custom metrics and logs | Zero setup, AWS manages everything |
| Prometheus | Teams comfortable with self-hosting, PromQL users | Infrastructure cost only | High (you run and maintain it) |
| Datadog | Teams prioritizing speed and unified observability | Per-host pricing, scales with infra | Zero (fully managed SaaS) |
The decision framework:
- If you have no DevOps engineers and run everything on AWS, start with CloudWatch.
- If you have engineers who can manage infrastructure and want query flexibility, use Prometheus.
- If your team is small but well-funded and time-to-insight matters more than cost, use Datadog.
CloudWatch: The Default AWS Choice
CloudWatch is already running. Every EC2 instance, ECS task, Lambda function, and RDS database emits metrics to CloudWatch automatically. No agent installation, no configuration file, no external service.
What You Get for Free
Basic metrics are included with AWS services:
- ECS: CPU, memory, network I/O per task
- RDS: connections, read/write IOPS, replication lag
- Lambda: invocations, duration, errors, throttles
- ALB: request count, latency, HTTP status codes
Logs go to CloudWatch Logs via the awslogs driver for ECS or Lambda runtime integration. You pay for storage, not ingestion.
When CloudWatch Works Well
I use CloudWatch for:
- Small teams without dedicated DevOps engineers
- AWS-only stacks where all services are first-party AWS
- Cost-sensitive projects where monitoring budget is tight
- Basic alerting on threshold breaches
Example: An early-stage startup running 3 ECS services, 1 RDS instance, and 5 Lambda functions. CloudWatch gives them everything they need for under 30 USD per month.
Where CloudWatch Falls Short
Query language limitations. CloudWatch Insights uses its own query syntax. It works for simple queries but struggles with aggregations across multiple dimensions.
# CloudWatch Insights query (verbose)
fields @timestamp, @message
| filter @message like /ERROR/
| stats count() by bin(5m)
Compare to PromQL:
# Prometheus query (concise)
rate(http_requests_total{status=~"5.."}[5m])
Dashboard limitations. You can build dashboards in CloudWatch, but the UI is clunky. Creating a dashboard with 10 graphs takes 30 minutes because every widget requires manual configuration. No dashboard-as-code support without third-party tools.
No distributed tracing. CloudWatch has no native APM or distributed tracing. You can see that a service is slow, but not why or which downstream dependency is the bottleneck. You need X-Ray for that, which is a separate service with separate billing.
Cost Breakdown
| Item | Monthly Cost (10 Services) |
|---|---|
| Standard metrics | Free (included with AWS services) |
| Custom metrics (100 metrics) | 30 USD |
| Logs (10 GB ingestion, 1 month retention) | 5 USD |
| Alarms (20 alarms) | 2 USD |
| Total | 37 USD |
If you enable detailed monitoring or store logs longer than 1 month, costs increase. But for basic production monitoring, CloudWatch is hard to beat on price.
Setup Example
Enable container insights for an ECS cluster:
aws ecs update-cluster-settings \
  --cluster my-cluster \
  --settings name=containerInsights,value=enabled
Create an alarm for high CPU:
aws cloudwatch put-metric-alarm \
  --alarm-name high-cpu-api-service \
  --alarm-description "Alert when API CPU exceeds 80%" \
  --metric-name CPUUtilization \
  --namespace AWS/ECS \
  --statistic Average \
  --period 300 \
  --threshold 80 \
  --comparison-operator GreaterThanThreshold \
  --evaluation-periods 2 \
  --dimensions Name=ServiceName,Value=api Name=ClusterName,Value=my-cluster \
  --alarm-actions arn:aws:sns:ap-southeast-1:123456789012:alerts
That is it. No agents, no exporters, no configuration management.
Prometheus: The Self-Hosted Powerhouse
Prometheus is the de facto standard for Kubernetes monitoring, but it works just as well for ECS, EC2, and even Lambda if you are willing to build the infrastructure.
Why Prometheus Wins on Query Power
PromQL is a purpose-built query language for time-series data. It handles aggregations, rates, and predictions elegantly:
# Request rate by endpoint, averaged over 5 minutes
rate(http_requests_total[5m])

# 95th percentile latency
histogram_quantile(0.95, rate(http_request_duration_seconds_bucket[5m]))

# Predict disk full time based on current growth rate
predict_linear(node_filesystem_avail_bytes[1h], 4 * 3600)
CloudWatch cannot do this. You would need to export data to a separate analytics tool.
Service Discovery and Dynamic Targets
Prometheus uses service discovery to automatically detect targets. For ECS, you configure it to query the ECS API and scrape every running task:
scrape_configs:
  - job_name: 'ecs-tasks'
    ec2_sd_configs:
      - region: ap-southeast-1
        port: 9090
        filters:
          - name: tag:Monitoring
            values: ['enabled']
    relabel_configs:
      - source_labels: [__meta_ec2_tag_Name]
        target_label: instance
When you deploy a new service, Prometheus discovers it automatically. No manual configuration updates.
When to Choose Prometheus
I recommend Prometheus for:
- Teams with DevOps capacity to run and maintain infrastructure
- Multi-cloud or hybrid setups where CloudWatch does not cover all services
- Advanced querying needs like SLO tracking or capacity planning
- Kubernetes environments where Prometheus is already the standard
Where Prometheus Requires Work
You run it. Prometheus needs EC2 instances (or ECS tasks), persistent storage, and regular maintenance. That means:
- Scaling Prometheus when metric volume grows
- Managing retention and storage
- Backing up data
- Upgrading versions
- Handling high availability with federation or Thanos
For a small team, this operational burden is significant.
Limited long-term storage. Prometheus stores data locally with a default 15-day retention. For long-term storage, you need Thanos, Cortex, or Amazon Managed Service for Prometheus. Each adds complexity.
No built-in alerting UI. Prometheus has Alertmanager for routing alerts, but it is configuration-driven. You write alert rules in YAML. For teams used to point-and-click alert setup, this is a learning curve.
Cost Breakdown
| Item | Monthly Cost (10 Services) |
|---|---|
| EC2 instance (t3.medium for Prometheus) | 30 USD |
| EBS storage (100 GB for metrics) | 10 USD |
| ALB for Prometheus UI | 20 USD |
| Backup snapshots | 5 USD |
| Total | 65 USD |
Prometheus itself is free, but you pay for the infrastructure to run it. For larger deployments, the cost scales with metric volume and retention requirements.
Setup Example
Run Prometheus on ECS Fargate:
# prometheus.yml
global:
  scrape_interval: 15s
  evaluation_interval: 15s

scrape_configs:
  - job_name: 'api-service'
    static_configs:
      - targets: ['api.internal:8080']
    metrics_path: '/metrics'
Deploy as an ECS task with persistent EFS storage for data retention. Expose the UI via ALB with authentication.
For production, I usually add Grafana for dashboards. Prometheus provides the data, Grafana provides the visualization. The combination is powerful but requires managing two systems.
Datadog: The Managed Alternative
Datadog is expensive. Let me say that upfront. But for small teams shipping fast, it saves time in ways that justify the cost.
What You Get Out of the Box
- Unified dashboards for logs, metrics, and traces in one UI
- Automatic instrumentation for Go, Java, Node.js, Python with minimal code changes
- APM and distributed tracing built-in, no separate service required
- Alerting UI with anomaly detection and forecasting
- SLO tracking with error budgets and burn rate alerts
Datadog automatically correlates metrics, logs, and traces. When a service has high error rates, you click through to see logs and traces for failing requests. CloudWatch and Prometheus cannot do this without significant glue code.
When Datadog Makes Sense
I recommend Datadog for:
- Small teams with limited engineering time for tooling
- Product-focused startups where speed to market matters more than infrastructure cost
- Complex microservices where distributed tracing is critical
- Teams with budget willing to pay for reduced operational overhead
Example: A 5-person startup with 15 microservices. They tried Prometheus but spent 2 days per week managing dashboards and alerts. Switching to Datadog cost 400 USD per month but freed up 8 engineer-days per month. The ROI was obvious.
Where Datadog Costs Add Up
Pricing is per-host and per-feature:
- Infrastructure monitoring: 15 USD per host per month
- APM: 31 USD per host per month
- Log management: 1.70 USD per GB ingested, 1.27 USD per million log events
- Custom metrics: 0.05 USD per custom metric per month
A typical setup with 10 ECS tasks, APM enabled, and 50 GB of logs per month:
10 hosts × 15 USD = 150 USD (infra monitoring)
10 hosts × 31 USD = 310 USD (APM)
50 GB × 1.70 USD = 85 USD (log ingestion)
Total: 545 USD per month
For comparison, CloudWatch would cost around 50 USD for the same workload.
Cost Control Strategies
If you use Datadog, control costs by:
- Sampling traces instead of capturing 100 percent
- Excluding noisy logs with filters before ingestion
- Using CloudWatch for long-term log retention and only sending recent logs to Datadog
- Disabling APM for low-traffic services that do not need distributed tracing
Setup Example
Install the Datadog agent on ECS:
{
  "family": "datadog-agent",
  "containerDefinitions": [
    {
      "name": "datadog-agent",
      "image": "public.ecr.aws/datadog/agent:latest",
      "environment": [
        {"name": "DD_API_KEY", "value": "YOUR_API_KEY"},
        {"name": "DD_SITE", "value": "datadoghq.com"},
        {"name": "ECS_FARGATE", "value": "true"}
      ],
      "cpu": 256,
      "memory": 512
    }
  ]
}
Instrument your Go application:
import "gopkg.in/DataDog/dd-trace-go.v1/ddtrace/tracer"

func main() {
    tracer.Start(
        tracer.WithService("api"),
        tracer.WithEnv("production"),
    )
    defer tracer.Stop()

    // Your application code
}
That is it. Metrics, logs, and traces flow to Datadog automatically. Dashboards populate within minutes.
Decision Framework
Here is how I choose for client projects:
Choose CloudWatch if:
- You run entirely on AWS
- Your team has no dedicated DevOps engineers
- Monitoring budget is under 100 USD per month
- Basic metrics and threshold alerts are sufficient
Choose Prometheus if:
- You have engineers comfortable managing infrastructure
- You need advanced query capabilities with PromQL
- You run multi-cloud or on-premise workloads
- You already use Kubernetes where Prometheus is standard
Choose Datadog if:
- Your team is small and engineering time is expensive
- You need APM and distributed tracing
- Fast time-to-insight is more important than cost
- You can budget 500+ USD per month for monitoring
Hybrid Approach
The most common production setup I see: CloudWatch for AWS service metrics, Prometheus for application metrics, and Datadog for critical services that need APM.
Example architecture:
- CloudWatch captures ECS, RDS, and ALB metrics automatically
- Prometheus scrapes custom application metrics from all services
- Datadog APM instruments only the 3 most complex services with distributed traces
- All three send alerts to PagerDuty or Opsgenie
This balances cost and capability. You pay for Datadog only where tracing is critical, use Prometheus for flexible queries, and let CloudWatch handle the rest.
What I Use for My Projects
For client projects, I start with CloudWatch and add Prometheus when the team can handle the operational burden. I recommend Datadog only when the client explicitly prioritizes speed over cost.
For my own projects, I run Prometheus with Grafana on a single t3.small instance. Total cost: 25 USD per month. I get powerful queries, custom dashboards, and full control. The tradeoff is I spend 2 hours per month maintaining it.
If you need help setting up monitoring that fits your team and budget, I offer DevOps support where we build monitoring infrastructure tailored to your stack and team size. This ties into broader DevOps practices for small teams where monitoring is one part of the overall automation strategy.
For examples of monitoring in real systems, see my ECS Fargate architecture and AWS architecture patterns where monitoring setup is covered in context.