Observability from Scratch: Logs, Metrics, Traces in Go
A hands-on guide to adding full observability to Go services using OpenTelemetry, structured logging, and Prometheus metrics with minimal boilerplate.
Most Go services I audit have the same gap: logs that print plaintext strings, no metrics endpoint, and no distributed tracing. When something breaks at 2 AM, the only tool is grep on a wall of text. That is not a debugging experience, that is archaeology.
This guide walks through adding all three pillars of observability to a Go service: structured logging, Prometheus metrics, and OpenTelemetry traces. By the end, you will have a service that tells you exactly what is happening, what happened in the past, and which code path caused the problem.
This builds on the patterns from my production-ready Go API guide. The project structure and middleware chain from that guide are assumed here. If you are setting up Go services for the first time, start there.
The Three Pillars
Before code: a quick mental model.
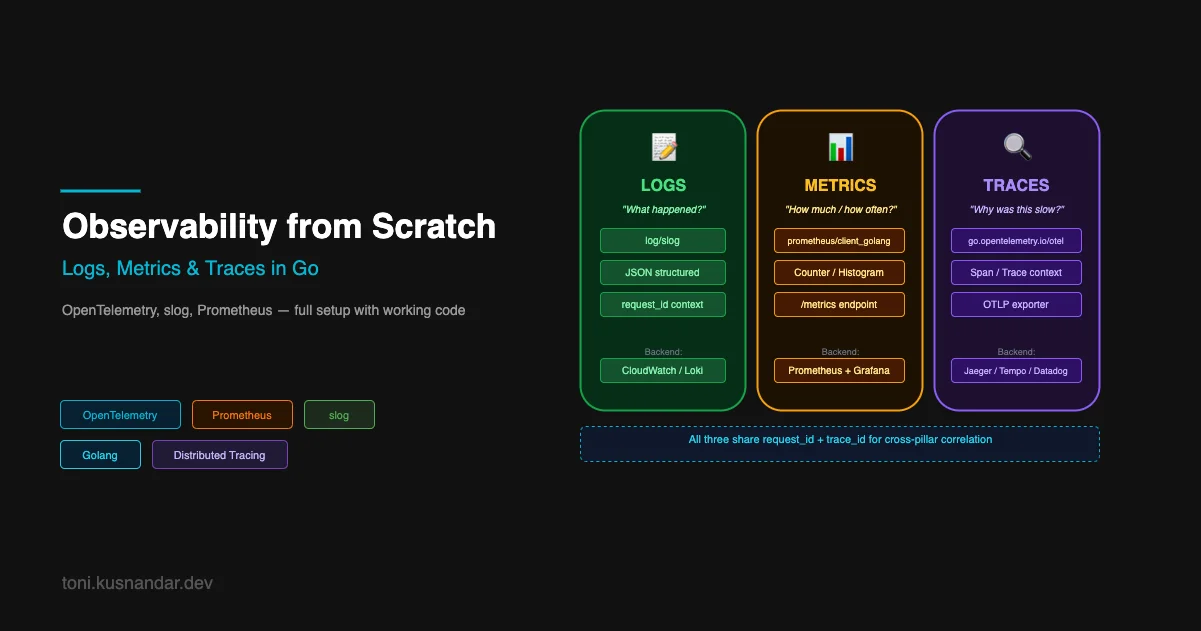
Logs answer “what happened.” They are the event stream of your application. Every request, every error, every state change. Structured logs make them queryable.
Metrics answer “how much and how often.” They are aggregated numbers over time: request rates, error percentages, latency percentiles. Perfect for dashboards and threshold alerts.
Traces answer “why was this slow.” A trace follows a single request across multiple services and function calls, showing exactly where time was spent.
Together they give you full observability. Monitoring dashboards use metrics. On-call debugging uses logs. Root cause analysis uses traces.
Structured Logging with slog
The Go standard library ships log/slog since 1.21. No external dependencies needed.
Setup
package main

import (
    "log/slog"
    "os"
)

func setupLogger(env string) *slog.Logger {
    var handler slog.Handler

    if env == "production" {
        // JSON format for log aggregation tools
        handler = slog.NewJSONHandler(os.Stdout, &slog.HandlerOptions{
            Level: slog.LevelInfo,
        })
    } else {
        // Human-readable format for local development
        handler = slog.NewTextHandler(os.Stdout, &slog.HandlerOptions{
            Level: slog.LevelDebug,
        })
    }

    return slog.New(handler)
}
Set it as the default logger in main.go:
logger := setupLogger(cfg.Env)
slog.SetDefault(logger)
Now slog.Info(...), slog.Error(...), and slog.Debug(...) work anywhere without passing the logger explicitly.
Request Logging Middleware
The most important log is the request log. Every HTTP request should produce exactly one log line with method, path, status, duration, and request ID:
func requestLoggingMiddleware(next http.Handler) http.Handler {
    return http.HandlerFunc(func(w http.ResponseWriter, r *http.Request) {
        start := time.Now()
        ww := middleware.NewWrapResponseWriter(w, r.ProtoMajor)

        next.ServeHTTP(ww, r)

        slog.InfoContext(r.Context(), "request",
            "method", r.Method,
            "path", r.URL.Path,
            "status", ww.Status(),
            "duration_ms", time.Since(start).Milliseconds(),
            "request_id", requestIDFromContext(r.Context()),
            "user_agent", r.UserAgent(),
            "remote_addr", r.RemoteAddr,
        )
    })
}
Output in production (JSON):
{
  "time": "2026-07-28T14:23:01Z",
  "level": "INFO",
  "msg": "request",
  "method": "GET",
  "path": "/api/v1/users/abc123",
  "status": 200,
  "duration_ms": 45,
  "request_id": "req-9f8a2b1c",
  "user_agent": "Mozilla/5.0",
  "remote_addr": "10.0.1.5:49832"
}
CloudWatch Logs Insights can query this directly:
fields @timestamp, path, status, duration_ms
| filter status >= 500
| sort @timestamp desc
| limit 20
Context-Aware Logging
Propagate request context through your service so every log line carries the request ID:
// Add logger with request context to context
func withLogger(ctx context.Context, requestID string) context.Context {
    logger := slog.With("request_id", requestID)
    return context.WithValue(ctx, loggerKey, logger)
}

// Retrieve logger from context
func loggerFromContext(ctx context.Context) *slog.Logger {
    if l, ok := ctx.Value(loggerKey).(*slog.Logger); ok {
        return l
    }
    return slog.Default()
}

// Use in service layer
func (s *UserService) GetUser(ctx context.Context, id string) (*User, error) {
    log := loggerFromContext(ctx)
    log.Debug("fetching user", "user_id", id)

    user, err := s.repo.GetByID(ctx, id)
    if err != nil {
        log.Error("failed to fetch user", "user_id", id, "error", err)
        return nil, err
    }

    log.Debug("user fetched", "user_id", id)
    return user, nil
}
Every log from this function automatically includes the request_id from the HTTP request that triggered it. No manual threading of IDs.
Prometheus Metrics
Prometheus metrics require two things: defining metrics and exposing them. The metrics endpoint is a scrape target for your Prometheus instance or Amazon Managed Service for Prometheus.
Dependency
go get github.com/prometheus/client_golang/prometheus
go get github.com/prometheus/client_golang/prometheus/promhttp
Define Metrics
Define metrics as package-level variables, not inside functions:
package metrics

import (
    "github.com/prometheus/client_golang/prometheus"
    "github.com/prometheus/client_golang/prometheus/promauto"
)

var (
    // HTTP request counter
    HTTPRequestsTotal = promauto.NewCounterVec(
        prometheus.CounterOpts{
            Name: "http_requests_total",
            Help: "Total number of HTTP requests",
        },
        []string{"method", "path", "status"},
    )

    // HTTP request duration histogram
    HTTPRequestDuration = promauto.NewHistogramVec(
        prometheus.HistogramOpts{
            Name:    "http_request_duration_seconds",
            Help:    "HTTP request duration in seconds",
            Buckets: prometheus.DefBuckets, // 5ms, 10ms, 25ms, 50ms, 100ms, 250ms, 500ms, 1s, 2.5s, 5s, 10s
        },
        []string{"method", "path"},
    )

    // Database query duration
    DBQueryDuration = promauto.NewHistogramVec(
        prometheus.HistogramOpts{
            Name:    "db_query_duration_seconds",
            Help:    "Database query duration in seconds",
            Buckets: []float64{0.001, 0.005, 0.01, 0.05, 0.1, 0.5, 1.0},
        },
        []string{"operation"},
    )

    // Active connections
    ActiveConnections = promauto.NewGauge(
        prometheus.GaugeOpts{
            Name: "active_connections",
            Help: "Number of active database connections",
        },
    )

    // Business metrics
    OrdersProcessed = promauto.NewCounterVec(
        prometheus.CounterOpts{
            Name: "orders_processed_total",
            Help: "Total orders processed",
        },
        []string{"status"},
    )
)
Metrics Middleware
Record request metrics in middleware so all handlers get instrumented automatically:
func metricsMiddleware(next http.Handler) http.Handler {
    return http.HandlerFunc(func(w http.ResponseWriter, r *http.Request) {
        start := time.Now()
        ww := middleware.NewWrapResponseWriter(w, r.ProtoMajor)

        next.ServeHTTP(ww, r)

        duration := time.Since(start).Seconds()
        statusStr := strconv.Itoa(ww.Status())

        // Normalize path to avoid high-cardinality issues
        // /api/v1/users/abc123 becomes /api/v1/users/:id
        path := normalizePath(r.URL.Path)

        metrics.HTTPRequestsTotal.WithLabelValues(r.Method, path, statusStr).Inc()
        metrics.HTTPRequestDuration.WithLabelValues(r.Method, path).Observe(duration)
    })
}

func normalizePath(path string) string {
    // Replace UUIDs and numeric IDs with :id placeholder
    // Prevents high-cardinality metrics from unique IDs
    uuidPattern := regexp.MustCompile(`[0-9a-f]{8}-[0-9a-f]{4}-[0-9a-f]{4}-[0-9a-f]{4}-[0-9a-f]{12}`)
    numPattern := regexp.MustCompile(`/[0-9]+`)

    path = uuidPattern.ReplaceAllString(path, ":id")
    path = numPattern.ReplaceAllString(path, "/:id")
    return path
}
Path normalization is critical. Without it, /users/user-id-1, /users/user-id-2, and /users/user-id-3 create three separate metric series. With millions of users, that is millions of series. Prometheus cannot handle that.
Expose Metrics Endpoint
import "github.com/prometheus/client_golang/prometheus/promhttp"

func NewRouter(h *Handler) http.Handler {
    r := chi.NewRouter()

    // Prometheus metrics endpoint (no auth, but restrict access via security group or ALB rules)
    r.Handle("/metrics", promhttp.Handler())

    // Health endpoints
    r.Get("/health", h.HealthCheck)

    // API routes
    r.Route("/api/v1", func(r chi.Router) {
        r.Use(metricsMiddleware)
        // ... routes
    })

    return r
}
Access http://localhost:8080/metrics and you will see all metrics in Prometheus text format.
Instrument Database Calls
Wrap your database queries to record duration:
func (r *UserRepo) GetByID(ctx context.Context, id string) (*domain.User, error) {
    timer := prometheus.NewTimer(metrics.DBQueryDuration.WithLabelValues("get_user_by_id"))
    defer timer.ObserveDuration()

    var user domain.User
    err := r.db.Pool.QueryRow(ctx,
        `SELECT id, name, email FROM users WHERE id = $1`,
        id,
    ).Scan(&user.ID, &user.Name, &user.Email)

    if err != nil {
        return nil, err
    }
    return &user, nil
}
Distributed Tracing with OpenTelemetry
OpenTelemetry is the standard for distributed tracing. Instrument once, export to any backend: Jaeger, Tempo, Datadog, AWS X-Ray.
Dependencies
go get go.opentelemetry.io/otel
go get go.opentelemetry.io/otel/trace
go get go.opentelemetry.io/otel/sdk/trace
go get go.opentelemetry.io/otel/exporters/otlp/otlptrace/otlptracehttp
go get go.opentelemetry.io/contrib/instrumentation/net/http/otelhttp
Initialize Tracer
package telemetry

import (
    "context"
    "fmt"

    "go.opentelemetry.io/otel"
    "go.opentelemetry.io/otel/exporters/otlp/otlptrace/otlptracehttp"
    "go.opentelemetry.io/otel/sdk/resource"
    sdktrace "go.opentelemetry.io/otel/sdk/trace"
    semconv "go.opentelemetry.io/otel/semconv/v1.21.0"
)

func InitTracer(ctx context.Context, serviceName, endpoint string) (func(context.Context) error, error) {
    exporter, err := otlptracehttp.New(ctx,
        otlptracehttp.WithEndpoint(endpoint),
        otlptracehttp.WithInsecure(), // Use TLS in production
    )
    if err != nil {
        return nil, fmt.Errorf("creating OTLP exporter: %w", err)
    }

    res, err := resource.New(ctx,
        resource.WithAttributes(
            semconv.ServiceName(serviceName),
            semconv.ServiceVersion("1.0.0"),
            semconv.DeploymentEnvironment("production"),
        ),
    )
    if err != nil {
        return nil, fmt.Errorf("creating resource: %w", err)
    }

    tp := sdktrace.NewTracerProvider(
        sdktrace.WithBatcher(exporter),
        sdktrace.WithResource(res),
        sdktrace.WithSampler(sdktrace.ParentBased(
            sdktrace.TraceIDRatioBased(0.1), // Sample 10% in production
        )),
    )

    otel.SetTracerProvider(tp)

    return tp.Shutdown, nil
}
Call this in main.go:
shutdown, err := telemetry.InitTracer(ctx, "api-service", cfg.OTLPEndpoint)
if err != nil {
    slog.Error("failed to initialize tracer", "error", err)
    os.Exit(1)
}
defer shutdown(ctx)
Trace HTTP Requests Automatically
Wrap your router with OpenTelemetry HTTP middleware:
import "go.opentelemetry.io/contrib/instrumentation/net/http/otelhttp"

func NewRouter(h *Handler) http.Handler {
    r := chi.NewRouter()

    // Wrap with OTel middleware
    return otelhttp.NewHandler(r, "api-service")
}
Every incoming HTTP request now creates a trace span automatically, including:
- HTTP method and path
- Status code
- Request duration
- Trace and span IDs in response headers
Manual Spans for Critical Functions
Add spans to important business logic:
import "go.opentelemetry.io/otel"

var tracer = otel.Tracer("user-service")

func (s *UserService) CreateOrder(ctx context.Context, userID string, items []Item) (*Order, error) {
    ctx, span := tracer.Start(ctx, "UserService.CreateOrder")
    defer span.End()

    // Add attributes to the span
    span.SetAttributes(
        attribute.String("user.id", userID),
        attribute.Int("order.item_count", len(items)),
    )

    // Validate items
    ctx, validateSpan := tracer.Start(ctx, "validateItems")
    if err := s.validateItems(ctx, items); err != nil {
        validateSpan.RecordError(err)
        validateSpan.End()
        return nil, err
    }
    validateSpan.End()

    // Create order in database
    order, err := s.repo.CreateOrder(ctx, userID, items)
    if err != nil {
        span.RecordError(err)
        return nil, err
    }

    span.SetAttributes(attribute.String("order.id", order.ID))
    return order, nil
}
Trace Database Calls
Instrument pgx with OpenTelemetry:
go get github.com/exaring/otelpgximport "github.com/exaring/otelpgx"
func NewDB(ctx context.Context, connString string) (*pgxpool.Pool, error) {
config, err := pgxpool.ParseConfig(connString)
if err != nil {
return nil, err
}
// Add OpenTelemetry tracing to all queries
config.ConnConfig.Tracer = otelpgx.NewTracer()
return pgxpool.NewWithConfig(ctx, config)
}Now every database query appears in your trace as a child span with the SQL query text.
Correlating Logs with Traces
The most powerful debugging workflow: click a slow trace, get the trace ID, search logs for that ID, and see the full event stream for that request.
Add trace IDs to every log line:
func requestLoggingMiddleware(next http.Handler) http.Handler {
    return http.HandlerFunc(func(w http.ResponseWriter, r *http.Request) {
        start := time.Now()
        ww := middleware.NewWrapResponseWriter(w, r.ProtoMajor)

        next.ServeHTTP(ww, r)

        // Extract trace info from context
        span := trace.SpanFromContext(r.Context())
        traceID := span.SpanContext().TraceID().String()
        spanID := span.SpanContext().SpanID().String()

        slog.InfoContext(r.Context(), "request",
            "method", r.Method,
            "path", r.URL.Path,
            "status", ww.Status(),
            "duration_ms", time.Since(start).Milliseconds(),
            "trace_id", traceID,  // Correlates to distributed trace
            "span_id", spanID,
        )
    })
}
When you see a slow request in your Prometheus dashboard, the workflow becomes:
- Find slow request in Grafana metrics dashboard
- Copy the time range
- Search logs by
trace_idfor that time range - Open trace in Jaeger/Tempo using the trace ID
- See exactly which function was slow
Putting It All Together
Here is the complete initialization in main.go:
func main() {
    ctx := context.Background()

    // Load config
    cfg, err := config.Load()
    if err != nil {
        slog.Error("failed to load config", "error", err)
        os.Exit(1)
    }

    // Setup structured logging
    logger := setupLogger(cfg.Env)
    slog.SetDefault(logger)

    // Initialize tracer
    shutdownTracer, err := telemetry.InitTracer(ctx, cfg.ServiceName, cfg.OTLPEndpoint)
    if err != nil {
        slog.Error("failed to initialize tracer", "error", err)
        os.Exit(1)
    }
    defer shutdownTracer(ctx)

    // Connect to database
    db, err := postgres.NewDB(ctx, cfg.DatabaseURL)
    if err != nil {
        slog.Error("failed to connect to database", "error", err)
        os.Exit(1)
    }
    defer db.Close()

    // Update active connections metric periodically
    go func() {
        ticker := time.NewTicker(30 * time.Second)
        for range ticker.C {
            stats := db.Pool.Stat()
            metrics.ActiveConnections.Set(float64(stats.TotalConns()))
        }
    }()

    // Build and start server
    h := handler.New(db, cfg)
    router := handler.NewRouter(h)

    srv := &http.Server{
        Addr:    fmt.Sprintf(":%d", cfg.Server.Port),
        Handler: router,
    }

    // Graceful shutdown
    go func() {
        slog.Info("server starting", "port", cfg.Server.Port)
        if err := srv.ListenAndServe(); err != nil && err != http.ErrServerClosed {
            slog.Error("server error", "error", err)
            os.Exit(1)
        }
    }()

    quit := make(chan os.Signal, 1)
    signal.Notify(quit, syscall.SIGINT, syscall.SIGTERM)
    <-quit

    shutdownCtx, cancel := context.WithTimeout(ctx, 15*time.Second)
    defer cancel()
    srv.Shutdown(shutdownCtx)

    slog.Info("server stopped")
}
Backend Choices
Where to send your telemetry data:
For metrics: Prometheus plus Grafana is the standard. Use Amazon Managed Service for Prometheus if you want to skip managing Prometheus yourself.
For traces: Grafana Tempo is free and integrates with Grafana dashboards. Jaeger is a good self-hosted option. If you already pay for Datadog, use their OTLP endpoint.
For logs: CloudWatch Logs works well for AWS-native setups. Grafana Loki is a great self-hosted option that correlates with Tempo traces natively.
See my comparison of monitoring tools in monitoring stack for startups if you have not decided on backends yet.
What to Alert On
With these three pillars in place, start with these four golden signals:
Latency: Alert when p99 latency exceeds your SLO:
histogram_quantile(0.99, rate(http_request_duration_seconds_bucket[5m])) > 1.0Error rate: Alert when error rate exceeds 1 percent:
rate(http_requests_total{status=~"5.."}[5m]) / rate(http_requests_total[5m]) > 0.01Saturation: Alert when database connections exceed 80 percent of pool size:
active_connections / 20 > 0.8Traffic: Alert on sudden traffic drops (possible deployment failure):
rate(http_requests_total[5m]) < rate(http_requests_total[5m] offset 1h) * 0.5Wrapping Up
With slog, Prometheus, and OpenTelemetry in place, your service tells you:
- What happened (logs with request IDs)
- How it is performing (metrics with histograms)
- Why something was slow (traces with spans)
Start with logging since it is zero-dependency. Add Prometheus metrics next. Add OpenTelemetry tracing last since it requires a backend. Each layer adds value independently.
If you need help setting up observability for your existing Go services, I offer DevOps support where we add monitoring, alerting, and tracing to production systems without downtime. This pairs well with the production-ready Go API patterns if you are building from scratch.
For portfolio examples of observability in real systems, see Go gRPC backend services where these patterns are applied at scale.