Right-Sizing ECS Fargate: Stop Paying for CPU and Memory You Do Not Use
A step-by-step guide to analyzing ECS Fargate task metrics and right-sizing CPU and memory allocation to reduce costs without sacrificing performance.
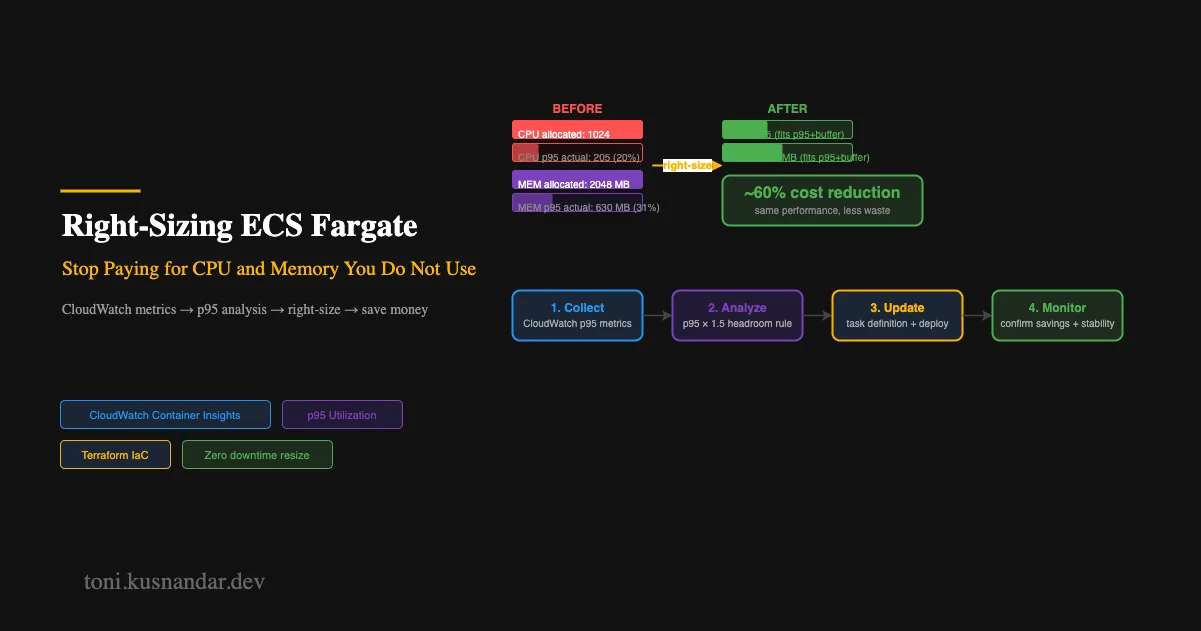
Fargate pricing is simple: you pay for the CPU and memory you allocate, not what you use. If your task is allocated 1 vCPU and runs at 15 percent utilization, you pay for the full vCPU. This makes over-provisioning expensive.
I see this pattern constantly during infrastructure audits: services allocated 1024 CPU and 2048 MB memory running at 10 to 20 percent utilization. The team picked those values during initial setup and never revisited them. The result is a Fargate bill that is 2 to 3 times higher than it should be.
This guide shows you how to analyze actual usage, calculate the correct allocation, and deploy changes without downtime. This ties into the broader AWS cost optimization strategies where right-sizing is one of the highest-impact actions.
Step 1: Enable Container Insights
Container Insights adds detailed task-level metrics to CloudWatch. Without it, you only get service-level aggregates, which hide the real utilization of individual tasks.
Enable via CLI:
aws ecs update-cluster-settings \
  --cluster my-cluster \
  --settings name=containerInsights,value=enabled
Or via Terraform:
resource "aws_ecs_cluster" "main" {
  name = "my-cluster"

  setting {
    name  = "containerInsights"
    value = "enabled"
  }
}
This adds metrics under the ECS/ContainerInsights namespace with dimensions for ClusterName, ServiceName, and TaskId. The cost is 0.30 USD per custom metric per month. For a cluster with 10 services, expect around 10 to 15 USD per month in additional CloudWatch costs. The savings from right-sizing will cover this cost many times over.
Step 2: Analyze Current Utilization
Pull 30 days of CPU and memory utilization at the p95 percentile. This is your actual peak usage excluding rare outliers.
CPU Utilization
aws cloudwatch get-metric-statistics \
  --namespace ECS/ContainerInsights \
  --metric-name CpuUtilized \
  --dimensions Name=ServiceName,Value=my-api Name=ClusterName,Value=my-cluster \
  --start-time 2026-07-01T00:00:00Z \
  --end-time 2026-07-31T23:59:59Z \
  --period 3600 \
  --statistics Maximum \
  --query 'Datapoints | sort_by(@, &Timestamp)[-1].Maximum'
This returns CPU in millicores. For example, 150 means 150 millicores out of the allocated CPU. If the task is allocated 1024 CPU (1 vCPU), then 150m is 14.6 percent utilization.
Convert to percentage:
CPU Utilization % = (CpuUtilized / CpuReserved) * 100You need CpuReserved from the task definition to calculate the percentage. Alternatively, use the CPUUtilization metric which gives you the percentage directly:
aws cloudwatch get-metric-statistics \
  --namespace AWS/ECS \
  --metric-name CPUUtilization \
  --dimensions Name=ServiceName,Value=my-api Name=ClusterName,Value=my-cluster \
  --start-time 2026-07-01T00:00:00Z \
  --end-time 2026-07-31T23:59:59Z \
  --period 3600 \
  --statistics Average \
  --extended-statistics p95
The p95 statistic is what you want. If the output shows 12.5, your service runs at 12.5 percent CPU utilization at the 95th percentile.
Memory Utilization
Same query for memory:
aws cloudwatch get-metric-statistics \
  --namespace AWS/ECS \
  --metric-name MemoryUtilization \
  --dimensions Name=ServiceName,Value=my-api Name=ClusterName,Value=my-cluster \
  --start-time 2026-07-01T00:00:00Z \
  --end-time 2026-07-31T23:59:59Z \
  --period 3600 \
  --statistics Average \
  --extended-statistics p95
If the p95 memory utilization is 18.0 and the task is allocated 2048 MB, actual usage is approximately 368 MB.
Step 3: Understand Fargate CPU and Memory Pairings
Fargate does not allow arbitrary CPU and memory combinations. Each CPU value has a fixed set of valid memory values.
| CPU (vCPU) | Memory (MB) |
|---|---|
| 256 (0.25) | 512, 1024, 2048 |
| 512 (0.5) | 1024, 2048, 3072, 4096 |
| 1024 (1) | 2048, 3072, 4096, 5120, 6144, 7168, 8192 |
| 2048 (2) | 4096 to 16384 (1 GB increments) |
| 4096 (4) | 8192 to 30720 (1 GB increments) |
Your target allocation must match one of these valid pairs. If your calculation says 600 CPU and 1500 MB, round up to the nearest valid pair: 1024 CPU and 2048 MB.
Step 4: Calculate Target Allocation
Use this formula:
Target CPU = p95 CPU utilization * current allocation * 1.5
Target Memory = p95 Memory utilization * current allocation * 1.5
The 1.5 multiplier gives you 50 percent headroom above peak usage for traffic spikes and temporary bursts.
Example Calculation
Current allocation:
- CPU: 1024 (1 vCPU)
- Memory: 2048 MB
Observed metrics (p95 over 30 days):
- CPU utilization: 12 percent
- Memory utilization: 18 percent
Target allocation:
- CPU: 1024 * 0.12 * 1.5 = 184 millicores → round to 256 CPU (0.25 vCPU)
- Memory: 2048 * 0.18 * 1.5 = 553 MB → round to 1024 MB (next valid pairing with 256 CPU)
Cost impact:
Current cost per task-hour:
- 1 vCPU: 0.04048 USD/hour
- 2048 MB: 0.004445 USD/GB/hour * 2 GB = 0.00889 USD/hour
- Total: 0.04937 USD/hour
New cost per task-hour:
- 0.25 vCPU: 0.01012 USD/hour
- 1024 MB: 0.004445 USD/hour
- Total: 0.01457 USD/hour
Savings: 70 percent per task
For a service running 5 tasks 24/7:
- Current: 0.04937 * 24 * 30 * 5 = 177 USD/month
- New: 0.01457 * 24 * 30 * 5 = 52 USD/month
- Savings: 125 USD/month per service
Multiply by 10 services and you save 1,250 USD per month, 15,000 USD per year.
Step 5: Update Task Definition
Create a new task definition revision with the updated CPU and memory:
resource "aws_ecs_task_definition" "api" {
  family                   = "my-api"
  requires_compatibilities = ["FARGATE"]
  network_mode             = "awsvpc"
  cpu                      = "256"    # Updated from 1024
  memory                   = "1024"   # Updated from 2048
  execution_role_arn       = aws_iam_role.ecs_execution.arn
  task_role_arn            = aws_iam_role.ecs_task.arn

  container_definitions = jsonencode([{
    name  = "api"
    image = "123456789012.dkr.ecr.ap-southeast-1.amazonaws.com/my-api:latest"
    portMappings = [{
      containerPort = 8080
      protocol      = "tcp"
    }]
  }])
}
Deploy the updated task definition via ECS service update:
aws ecs update-service \
  --cluster my-cluster \
  --service my-api \
  --task-definition my-api:42 \
  --force-new-deployment
ECS starts new tasks with the updated resource allocation and drains old tasks once the new ones pass health checks. The deployment completes in 5 to 10 minutes with zero downtime.
Step 6: Monitor Post-Deployment
After deployment, monitor for 24 to 48 hours to verify the new allocation is sufficient.
Check p95 CPU and memory utilization with the new settings:
aws cloudwatch get-metric-statistics \
  --namespace AWS/ECS \
  --metric-name CPUUtilization \
  --dimensions Name=ServiceName,Value=my-api Name=ClusterName,Value=my-cluster \
  --start-time 2026-08-02T00:00:00Z \
  --end-time 2026-08-03T23:59:59Z \
  --period 3600 \
  --extended-statistics p95
If p95 CPU exceeds 80 percent sustained, bump up one tier. If it stays below 60 percent, consider downsizing further.
Set CloudWatch alarms to alert if utilization spikes:
resource "aws_cloudwatch_metric_alarm" "high_cpu" {
  alarm_name          = "my-api-high-cpu"
  comparison_operator = "GreaterThanThreshold"
  evaluation_periods  = 2
  metric_name         = "CPUUtilization"
  namespace           = "AWS/ECS"
  period              = 300
  statistic           = "Average"
  threshold           = 85
  alarm_description   = "CPU utilization exceeds 85% for 10 minutes"
  alarm_actions       = [aws_sns_topic.alerts.arn]

  dimensions = {
    ClusterName = "my-cluster"
    ServiceName = "my-api"
  }
}
Common Pitfalls
Pitfall 1: Using Average Instead of p95
Average usage hides peak demand. A service with 5 percent average CPU might spike to 60 percent during traffic bursts. If you size for the average, you will throttle during peaks.
Always use p95 or p99 percentile metrics for sizing decisions.
Pitfall 2: Not Accounting for Traffic Growth
If your traffic is growing 20 percent per month, the p95 from last month is already outdated. Factor in expected growth when calculating target allocation.
For growing services, either:
- Run this analysis monthly and adjust incrementally
- Add 2x headroom instead of 1.5x to accommodate growth
Pitfall 3: Downsizing Memory-Intensive Services Too Aggressively
Some workloads are memory-bound, not CPU-bound. A background job processing large files might use 80 percent memory at 10 percent CPU. Downsizing memory to match CPU utilization will cause OOM kills.
Always check both CPU and memory independently. Size for whichever is higher.
Pitfall 4: Ignoring Container Startup Memory
Java services and Node.js services with large dependency trees use significant memory during startup. The running state might use 400 MB, but startup peaks at 800 MB.
If tasks keep failing health checks after downsizing memory, this is usually why. Check the memory spike during container initialization, not just steady-state usage.
Advanced: Automate Right-Sizing with AWS Compute Optimizer
AWS Compute Optimizer analyzes CloudWatch metrics and recommends optimal ECS task sizing automatically.
Enable Compute Optimizer:
aws compute-optimizer update-enrollment-status \
  --status Active
Wait 12 to 24 hours for analysis, then retrieve recommendations:
aws compute-optimizer get-ecs-service-recommendations \
  --service-arns arn:aws:ecs:ap-southeast-1:123456789012:service/my-cluster/my-api
Output includes:
- Current configuration
- Recommended configuration
- Expected cost savings
- Performance risk assessment
Use this as a starting point. Compute Optimizer is conservative and often recommends slightly higher allocations than necessary.
When Not to Downsize
Do not right-size:
Services with unpredictable traffic spikes. If your service handles sporadic batch jobs or webhooks with highly variable load, maintain higher allocation to absorb bursts. Auto-scaling helps, but new tasks take 30 to 60 seconds to start. Higher base allocation prevents dropped requests during scale-up.
Services with strict latency SLAs. If your p99 latency must stay under 100ms, any CPU throttling will blow that budget. Keep allocation higher to ensure consistent performance.
Services in early development. If the service is changing rapidly, usage patterns are unstable. Wait until the service stabilizes before right-sizing.
Wrapping Up
Right-sizing ECS Fargate tasks is one of the highest-ROI cost optimizations you can make. It requires no architectural changes, no code changes, and takes a few hours to implement across all services.
The pattern:
- Enable Container Insights
- Analyze 30 days of p95 CPU and memory utilization
- Calculate target allocation with 1.5x headroom
- Update task definitions and deploy
- Monitor for 48 hours and adjust if needed
For a team running 10 services, this typically saves 1,000 to 2,000 USD per month. That compounds to 12,000 to 24,000 USD per year with minimal ongoing effort.
If you want help auditing your ECS infrastructure, my cloud cost optimization service includes detailed ECS analysis, recommendations, and Terraform updates for all your services. This is part of the broader AWS cost optimization strategies where right-sizing is covered at a high level.
For context on ECS architecture patterns that make right-sizing easier, see my guide on why I choose ECS Fargate over Kubernetes and AWS architecture for small teams.