ECS Auto Scaling: Target Tracking vs Step Scaling Explained
A practical guide to configuring ECS Fargate auto scaling with target tracking and step scaling policies, including when to use each and full Terraform examples.
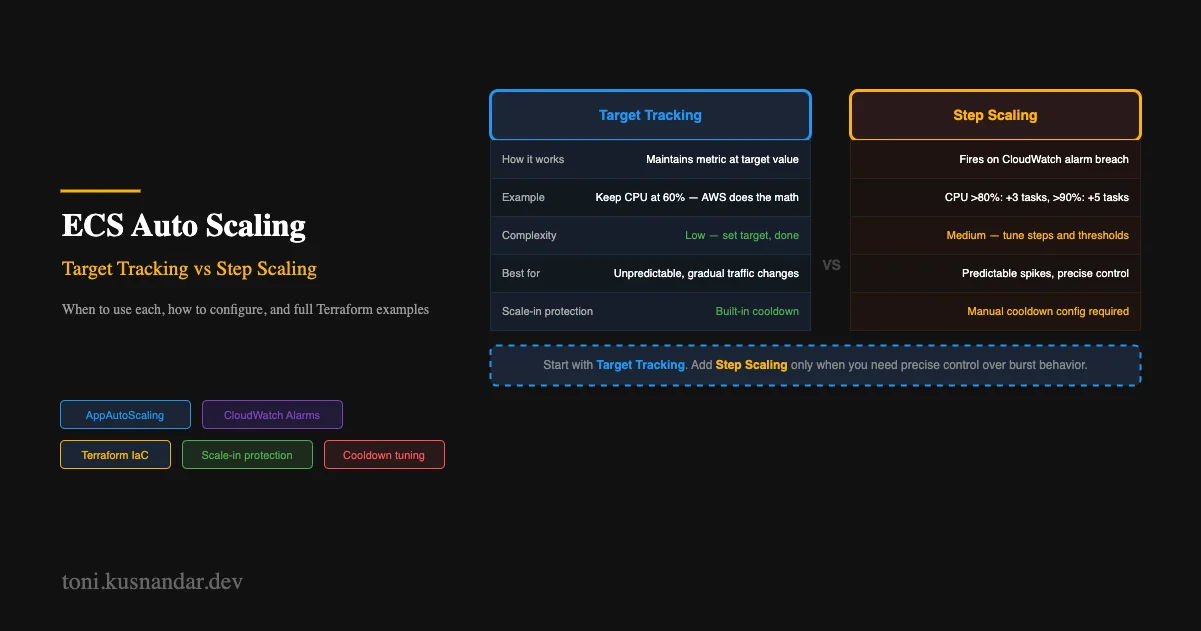
Auto scaling is one of those things that looks simple until it is not working. A service that does not scale fast enough drops requests during traffic spikes. One that scales too aggressively drives up costs and creates instability. Getting the configuration right requires understanding how the two scaling policy types behave.
ECS supports two types of auto scaling policies: target tracking and step scaling. Most teams pick one and stick with it without understanding the tradeoffs. This guide covers both, when to use each, and the complete Terraform configuration.
This ties into the right-sizing ECS Fargate guide. Right-sizing sets the baseline resource allocation per task. Auto scaling determines how many tasks run at any given time.
How ECS Auto Scaling Works
ECS auto scaling uses Application Auto Scaling as the underlying service. It operates on two dimensions:
- Minimum capacity: the floor, tasks never drop below this count
- Maximum capacity: the ceiling, tasks never exceed this count
- Desired count: the current target, adjusted by scaling policies
Scaling policies watch CloudWatch metrics and adjust desired count within the min/max range.
Min: 2 tasks
Max: 10 tasks
Desired: starts at 2, scaling adjusts it between 2 and 10
Register your ECS service as a scalable target first:
resource "aws_appautoscaling_target" "api" {
  max_capacity       = 10
  min_capacity       = 2
  resource_id        = "service/${aws_ecs_cluster.main.name}/${aws_ecs_service.api.name}"
  scalable_dimension = "ecs:service:DesiredCount"
  service_namespace  = "ecs"
}
This is required before attaching any scaling policy.
Target Tracking Scaling
Target tracking is the easier approach. You specify a target value for a metric, and AWS automatically calculates how many tasks to add or remove to keep the metric at that target.
Think of it like a thermostat: you set the temperature, the thermostat handles the rest.
Setup with CPU Utilization
resource "aws_appautoscaling_policy" "cpu_target_tracking" {
  name               = "my-api-cpu-target-tracking"
  policy_type        = "TargetTrackingScaling"
  resource_id        = aws_appautoscaling_target.api.resource_id
  scalable_dimension = aws_appautoscaling_target.api.scalable_dimension
  service_namespace  = aws_appautoscaling_target.api.service_namespace

  target_tracking_scaling_policy_configuration {
    predefined_metric_specification {
      predefined_metric_type = "ECSServiceAverageCPUUtilization"
    }

    target_value       = 60.0   # Scale to keep CPU around 60%
    scale_in_cooldown  = 300    # Wait 5 min before scaling in
    scale_out_cooldown = 60     # Wait 1 min before scaling out again
  }
}
With this policy, ECS targets 60 percent average CPU utilization across all running tasks. If traffic increases and CPU climbs to 80 percent, ECS adds tasks. If traffic drops and CPU falls to 30 percent, ECS removes tasks after the scale-in cooldown.
Why 60 Percent, Not 80 Percent
I target 60 percent rather than 80 percent for a specific reason: new Fargate tasks take 30 to 90 seconds to start. If you wait until 80 percent CPU to scale out, the service is already under stress by the time new tasks become available.
At 60 percent target, scaling triggers earlier, giving new tasks time to start before performance degrades. The tradeoff is slightly more over-provisioning during normal operation.
For services where startup time is under 30 seconds, you can push the target to 70 percent. For services with long JVM warmup or large dependency loading, drop to 50 percent.
Memory Utilization Target
For memory-bound services like JVM applications:
resource "aws_appautoscaling_policy" "memory_target_tracking" {
  name               = "my-api-memory-target-tracking"
  policy_type        = "TargetTrackingScaling"
  resource_id        = aws_appautoscaling_target.api.resource_id
  scalable_dimension = aws_appautoscaling_target.api.scalable_dimension
  service_namespace  = aws_appautoscaling_target.api.service_namespace

  target_tracking_scaling_policy_configuration {
    predefined_metric_specification {
      predefined_metric_type = "ECSServiceAverageMemoryUtilization"
    }

    target_value       = 70.0
    scale_in_cooldown  = 300
    scale_out_cooldown = 60
  }
}
ALB Request Count Per Target
For request-driven scaling where CPU does not correlate well with load:
resource "aws_appautoscaling_policy" "request_count_tracking" {
  name               = "my-api-request-tracking"
  policy_type        = "TargetTrackingScaling"
  resource_id        = aws_appautoscaling_target.api.resource_id
  scalable_dimension = aws_appautoscaling_target.api.scalable_dimension
  service_namespace  = aws_appautoscaling_target.api.service_namespace

  target_tracking_scaling_policy_configuration {
    predefined_metric_specification {
      predefined_metric_type = "ALBRequestCountPerTarget"
      resource_label         = "${aws_lb.main.arn_suffix}/${aws_lb_target_group.api.arn_suffix}"
    }

    target_value       = 1000   # 1000 requests per task
    scale_in_cooldown  = 300
    scale_out_cooldown = 60
  }
}
This scales based on requests per task rather than CPU. Useful for services that handle variable-complexity requests where CPU per request varies significantly.
Attach Multiple Policies
You can attach both CPU and memory target tracking to the same service. ECS scales out when either metric exceeds its target, and scales in only when both metrics are below their targets:
# Both policies on the same scalable target
resource "aws_appautoscaling_policy" "cpu" { ... }
resource "aws_appautoscaling_policy" "memory" { ... }
This is the recommended approach for services where both CPU and memory matter.
Step Scaling
Step scaling gives you explicit control over scaling behavior at different metric thresholds. You define alarms and specify exactly how many tasks to add or remove when each alarm fires.
When Step Scaling Beats Target Tracking
Step scaling is better when:
- You need different scale-out rates for mild vs severe load increases
- Your traffic has a binary pattern, quiet then suddenly very busy
- You want to scale out aggressively on severe spikes but conservatively on mild ones
- You need to scale based on a custom metric that target tracking does not support
Complete Step Scaling Setup
Step scaling requires CloudWatch alarms that feed scaling policies:
# Alarm: moderate CPU
resource "aws_cloudwatch_metric_alarm" "cpu_high_moderate" {
  alarm_name          = "my-api-cpu-high-moderate"
  comparison_operator = "GreaterThanThreshold"
  evaluation_periods  = 2
  metric_name         = "CPUUtilization"
  namespace           = "AWS/ECS"
  period              = 60
  statistic           = "Average"
  threshold           = 70

  dimensions = {
    ClusterName = aws_ecs_cluster.main.name
    ServiceName = aws_ecs_service.api.name
  }
}

# Alarm: severe CPU
resource "aws_cloudwatch_metric_alarm" "cpu_high_severe" {
  alarm_name          = "my-api-cpu-high-severe"
  comparison_operator = "GreaterThanThreshold"
  evaluation_periods  = 1   # React faster on severe spike
  metric_name         = "CPUUtilization"
  namespace           = "AWS/ECS"
  period              = 60
  statistic           = "Average"
  threshold           = 90

  dimensions = {
    ClusterName = aws_ecs_cluster.main.name
    ServiceName = aws_ecs_service.api.name
  }
}

# Alarm: low CPU for scale-in
resource "aws_cloudwatch_metric_alarm" "cpu_low" {
  alarm_name          = "my-api-cpu-low"
  comparison_operator = "LessThanThreshold"
  evaluation_periods  = 5   # Wait longer before scaling in
  metric_name         = "CPUUtilization"
  namespace           = "AWS/ECS"
  period              = 60
  statistic           = "Average"
  threshold           = 30

  dimensions = {
    ClusterName = aws_ecs_cluster.main.name
    ServiceName = aws_ecs_service.api.name
  }
}
Now attach scaling policies to each alarm:
# Scale out: moderate load adds 1 task
resource "aws_appautoscaling_policy" "scale_out_moderate" {
  name               = "my-api-scale-out-moderate"
  policy_type        = "StepScaling"
  resource_id        = aws_appautoscaling_target.api.resource_id
  scalable_dimension = aws_appautoscaling_target.api.scalable_dimension
  service_namespace  = aws_appautoscaling_target.api.service_namespace

  step_scaling_policy_configuration {
    adjustment_type         = "ChangeInCapacity"
    cooldown                = 60
    metric_aggregation_type = "Average"

    step_adjustment {
      scaling_adjustment          = 1      # Add 1 task
      metric_interval_lower_bound = 0      # When alarm is in breach (CPU > 70%)
    }
  }
}

# Associate with the moderate alarm
resource "aws_cloudwatch_metric_alarm" "cpu_high_moderate" {
  # ... (same as above, add alarm_actions)
  alarm_actions = [aws_appautoscaling_policy.scale_out_moderate.arn]
}

# Scale out: severe load adds 3 tasks immediately
resource "aws_appautoscaling_policy" "scale_out_severe" {
  name               = "my-api-scale-out-severe"
  policy_type        = "StepScaling"
  resource_id        = aws_appautoscaling_target.api.resource_id
  scalable_dimension = aws_appautoscaling_target.api.scalable_dimension
  service_namespace  = aws_appautoscaling_target.api.service_namespace

  step_scaling_policy_configuration {
    adjustment_type         = "ChangeInCapacity"
    cooldown                = 60
    metric_aggregation_type = "Average"

    step_adjustment {
      scaling_adjustment          = 3      # Add 3 tasks
      metric_interval_lower_bound = 0      # When alarm is in breach (CPU > 90%)
    }
  }
}

resource "aws_cloudwatch_metric_alarm" "cpu_high_severe" {
  # ...
  alarm_actions = [aws_appautoscaling_policy.scale_out_severe.arn]
}

# Scale in: remove 1 task when CPU drops below 30%
resource "aws_appautoscaling_policy" "scale_in" {
  name               = "my-api-scale-in"
  policy_type        = "StepScaling"
  resource_id        = aws_appautoscaling_target.api.resource_id
  scalable_dimension = aws_appautoscaling_target.api.scalable_dimension
  service_namespace  = aws_appautoscaling_target.api.service_namespace

  step_scaling_policy_configuration {
    adjustment_type         = "ChangeInCapacity"
    cooldown                = 300   # Longer cooldown before scaling in
    metric_aggregation_type = "Average"

    step_adjustment {
      scaling_adjustment          = -1     # Remove 1 task
      metric_interval_upper_bound = 0      # When alarm is in breach (CPU < 30%)
    }
  }
}

resource "aws_cloudwatch_metric_alarm" "cpu_low" {
  # ...
  alarm_actions = [aws_appautoscaling_policy.scale_in.arn]
}
This gives you:
- CPU above 70 percent for 2 minutes: add 1 task
- CPU above 90 percent for 1 minute: add 3 tasks immediately
- CPU below 30 percent for 5 minutes: remove 1 task
Scheduled Scaling
For services with predictable traffic patterns, scheduled scaling is more reliable than reactive scaling. You know when peak traffic happens, so scale proactively.
# Scale up before morning peak (8:45 AM Jakarta time = 01:45 UTC)
resource "aws_appautoscaling_scheduled_action" "scale_up_morning" {
  name               = "scale-up-morning"
  service_namespace  = aws_appautoscaling_target.api.service_namespace
  resource_id        = aws_appautoscaling_target.api.resource_id
  scalable_dimension = aws_appautoscaling_target.api.scalable_dimension
  schedule           = "cron(45 1 * * ? *)"  # 8:45 AM WIB = 01:45 UTC

  scalable_target_action {
    min_capacity = 5
    max_capacity = 20
  }
}

# Scale down after evening traffic drops (11 PM Jakarta time = 16:00 UTC)
resource "aws_appautoscaling_scheduled_action" "scale_down_night" {
  name               = "scale-down-night"
  service_namespace  = aws_appautoscaling_target.api.service_namespace
  resource_id        = aws_appautoscaling_target.api.resource_id
  scalable_dimension = aws_appautoscaling_target.api.scalable_dimension
  schedule           = "cron(0 16 * * ? *)"  # 11 PM WIB = 16:00 UTC

  scalable_target_action {
    min_capacity = 2
    max_capacity = 10
  }
}
Scheduled scaling adjusts the min/max capacity window. Target tracking and step scaling still operate within those bounds. During business hours, the minimum is 5 tasks so there is always capacity ready. At night, the minimum drops to 2 to reduce costs.
Combining Approaches
The most robust setup combines all three:
- Scheduled scaling sets the min/max window for known traffic patterns
- Target tracking handles smooth traffic variation within the window
- Step scaling handles sudden spikes that need immediate aggressive response
Night (min: 2, max: 5)
  └── Target tracking handles gradual changes

Day (min: 5, max: 20)  ← Scheduled scaling opens the window
  ├── Target tracking handles normal variation
  └── Step scaling adds extra tasks on sudden spikes
Cooling Down Correctly
Cooldown periods prevent rapid oscillation between scaling events.
Scale-out cooldown (60 seconds): After adding tasks, wait 60 seconds before adding more. This gives new tasks time to start and absorb load before the scaling algorithm concludes that more are needed.
Scale-in cooldown (300 seconds): After removing tasks, wait 5 minutes before removing more. Traffic rarely drops cleanly. A 5-minute window prevents removing tasks too aggressively during minor traffic dips.
If your service experiences rapid traffic spikes, shorten scale-out cooldown to 30 seconds. If your service handles bursty but short-lived traffic, lengthen scale-in cooldown to prevent tasks from being removed before the burst is fully processed.
Testing Your Scaling Configuration
Do not wait for production traffic to test auto scaling. Run a load test against your service and verify:
- Does scaling trigger at the expected threshold?
- How long until new tasks are registered in the target group?
- Does load distribute correctly across new tasks?
- Does scale-in trigger correctly when load drops?
A simple load test with Apache Benchmark:
# 100 concurrent users, 10,000 total requests
ab -n 10000 -c 100 https://api.example.com/health
Watch CloudWatch metrics while the test runs. Verify that desired task count increases during load and decreases after.
For production services, monitor the scale event history:
aws application-autoscaling describe-scaling-activities \
  --service-namespace ecs \
  --resource-id service/my-cluster/my-api \
  --query 'ScalingActivities[0:10]'
This shows recent scaling events with timestamps and reasons.
Decision Guide
| Scenario | Use |
|---|---|
| General-purpose stateless API | Target tracking on CPU at 60% |
| JVM or memory-heavy service | Target tracking on Memory at 70% |
| Request-driven with variable complexity | Target tracking on ALBRequestCountPerTarget |
| Sudden traffic spikes requiring immediate response | Step scaling with aggressive thresholds |
| Known daily traffic patterns | Scheduled scaling plus target tracking |
| All of the above | Combine scheduled + target tracking + step scaling |
Start simple. Target tracking covers 80 percent of use cases with minimal configuration. Add step scaling and scheduled scaling when target tracking alone is not responsive enough.
If you need help designing an auto scaling strategy for your ECS services, I offer DevOps support that covers scaling policy design, load testing, and monitoring configuration. This connects to blue-green deployments which affect how tasks scale during deployments, and right-sizing ECS tasks which determines the baseline capacity each task provides.
For examples of auto scaling in production architectures, see AWS architecture patterns for small teams and the ECS Fargate architecture guide.